Data and Findings
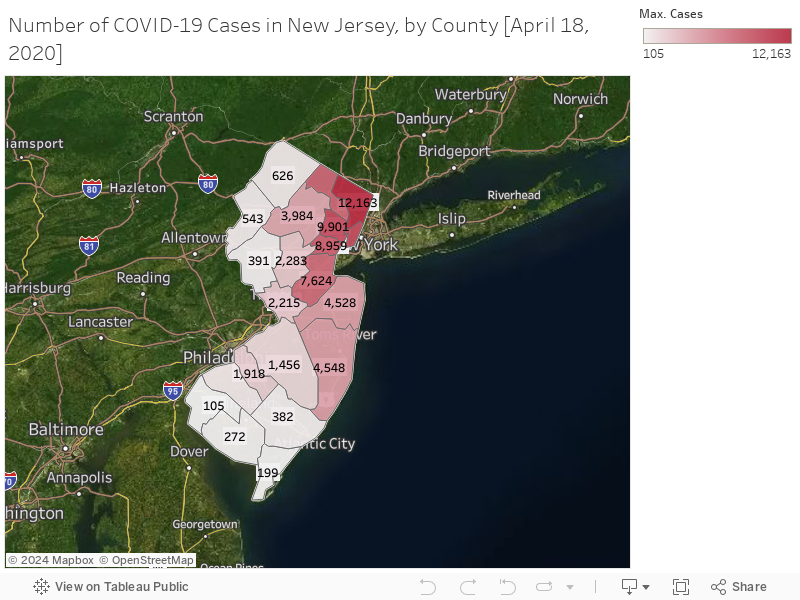
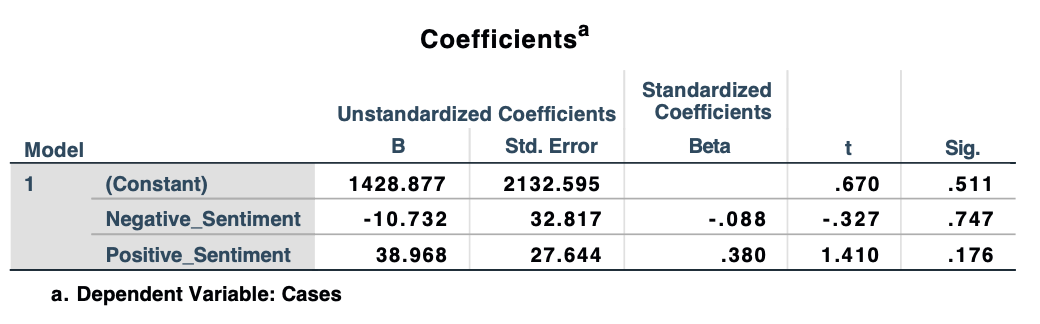
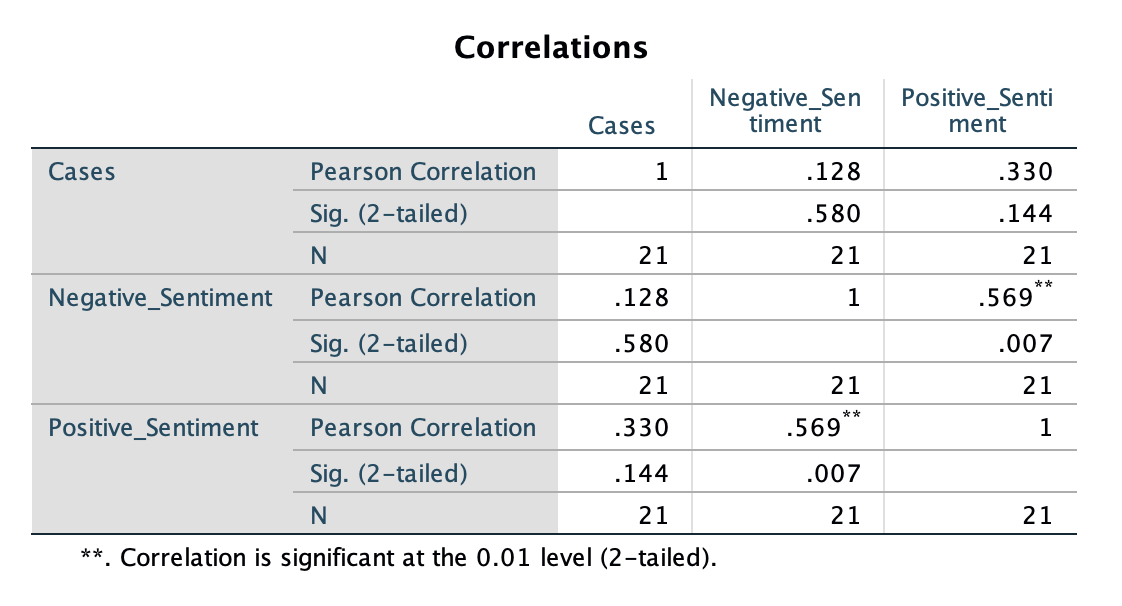
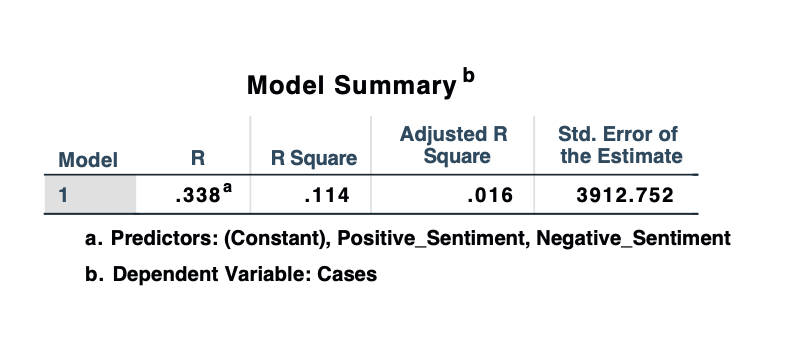
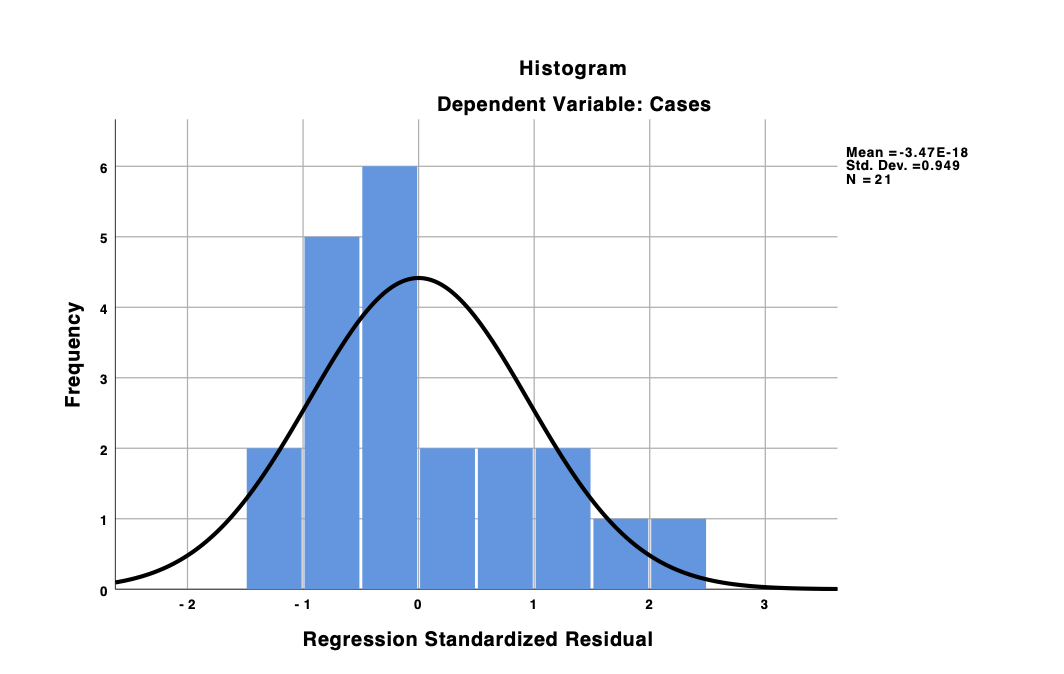
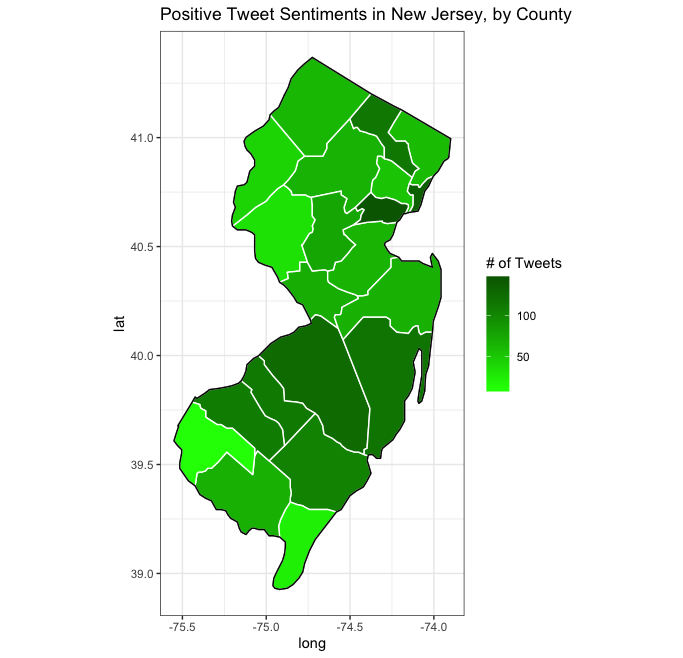
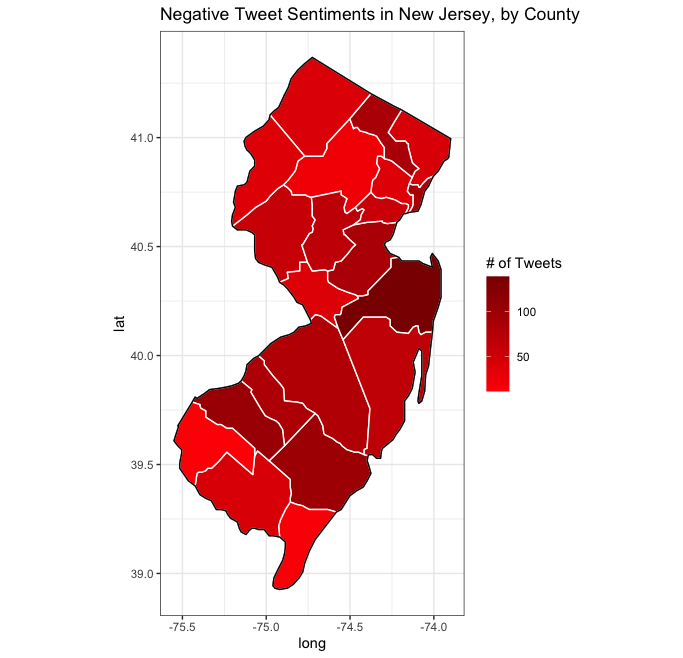
The information below consists of county geocode specifics, a Tableau visualization depicting the number of cases during the Tweet collection period, and a findings menu containing statistical analysis from SPSS, choropleth (heat) maps from R, and individual county sentiment analysis.
| # | County | Geocode | Area | Radius |
|---|
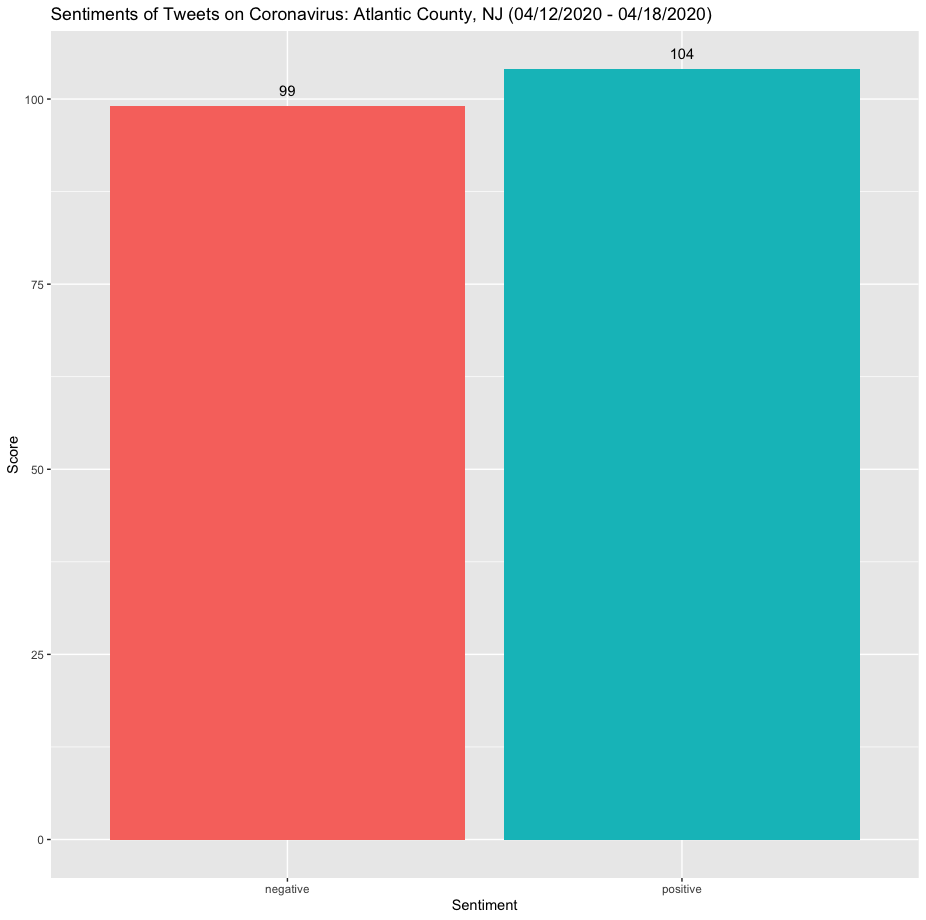
Negative Sentiment to Positive Sentiment Ratio: 99/104
Negative Sentiment to County Case Ratio: 99/382
Positive Sentiment to County Case Ratio: 52/191
Takeaways: Atlantic County's positive and negative sentiments closely matched each other. The level of activity within this county resulted in tweet sentiment counts that exceeded state averages.

Negative Sentiment to Positive Sentiment Ratio: 44/59
Negative Sentiment to County Case Ratio: 44/12163
Positive Sentiment to County Case Ratio: 59/12163
Takeaways: Bergen County's positive tweet sentiments exceeded its negative tweet sentiments. However, the county remains among New Jersey's most infected counties, despite the prevalence of positive tweet sentiments.
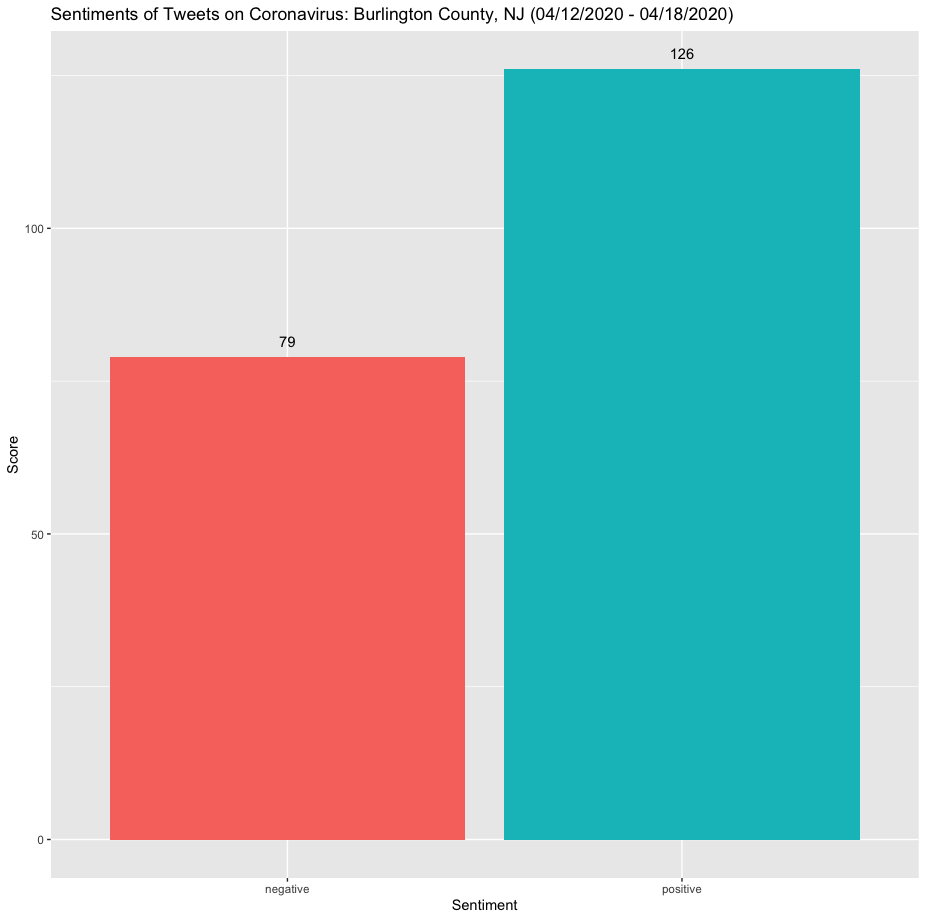
Negative Sentiment to Positive Sentiment Ratio: 79/126
Negative Sentiment to County Case Ratio: 79/1456
Positive Sentiment to County Case Ratio: 9/104
Takeaways: Burlington County is among New Jersey's largest counties in area, and is also among the states most positive with regard to tweet sentiments. Such an occurrence may be reflected in its lower-case count.
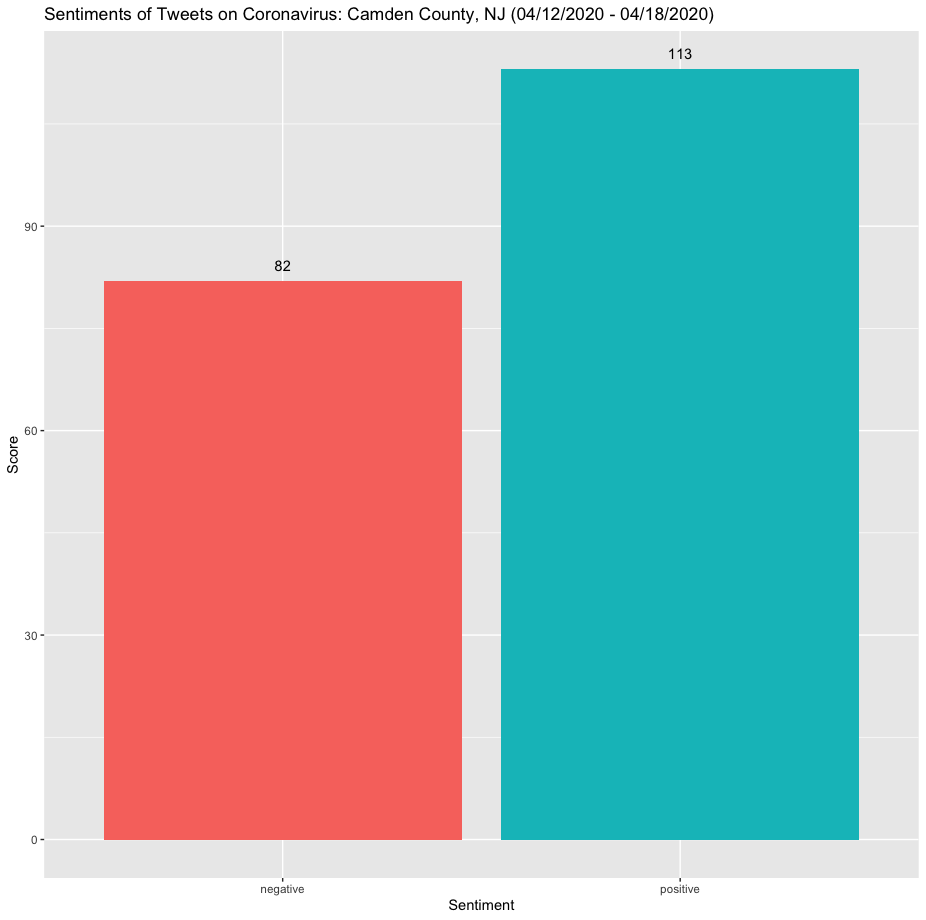
Negative Sentiment to Positive Sentiment Ratio: 82/113
Negative Sentiment to County Case Ratio: 41/959
Positive Sentiment to County Case Ratio: 113/1918
Takeaways: Camden County is among New Jersey's most economically adverse counties, but has positive tweet sentiments exceeding negative tweet sentiments. This is especially reassuring, given the smaller case count in comparison to other economically stronger counties.
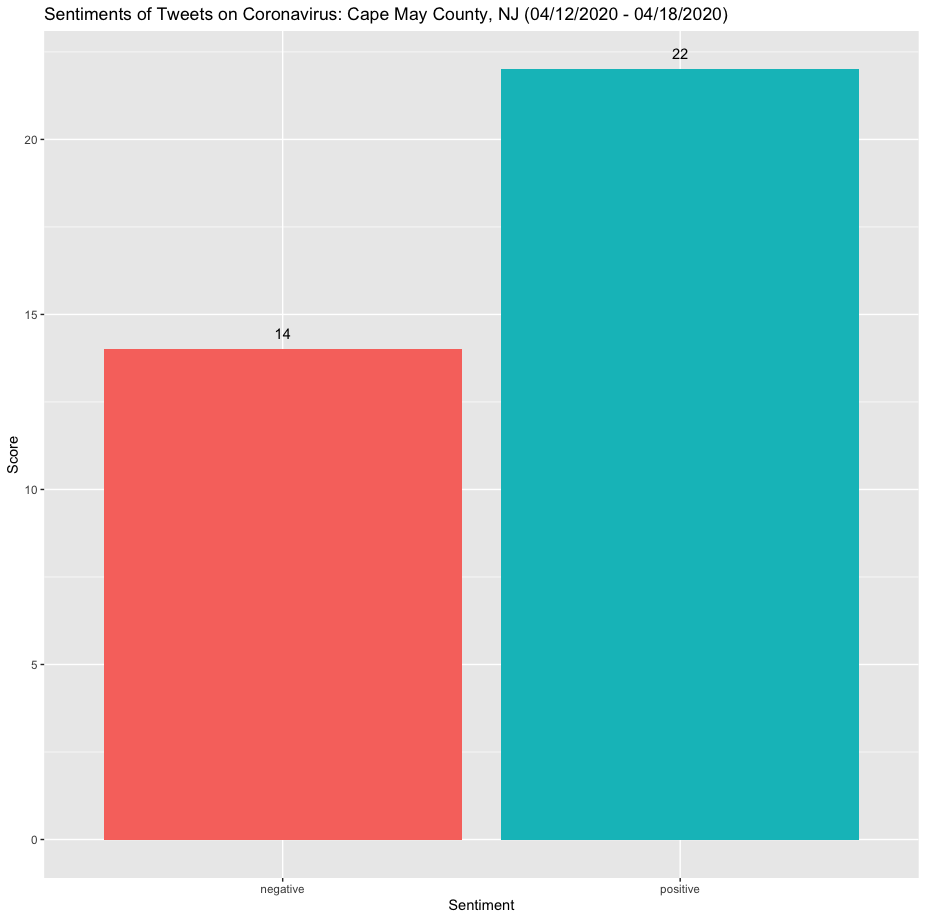
Negative Sentiment to Positive Sentiment Ratio: 11/7
Negative Sentiment to County Case Ratio: 14/199
Positive Sentiment to County Case Ratio: 22/199
Takeaways: Cape May County adheres to the intended predictive model, with its larger positive tweet sentiments count fostering case counts among New Jersey's lowest.
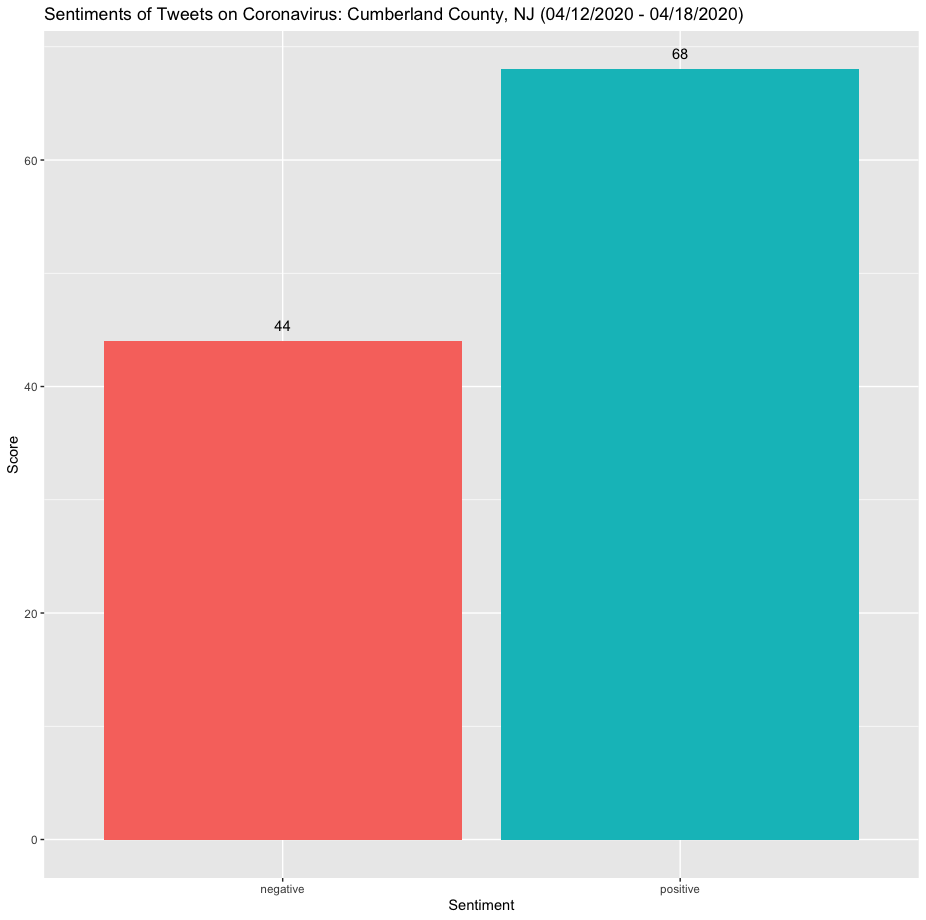
Negative Sentiment to Positive Sentiment Ratio: 11/17
Negative Sentiment to County Case Ratio: 11/68
Positive Sentiment to County Case Ratio: 1/4
Takeaways: Cumberland County mirrors trends in many of the other Southern New Jersey counties, with positive tweet sentiments overtaking negative tweet sentiments, and fewer cases in comparison to other counties.
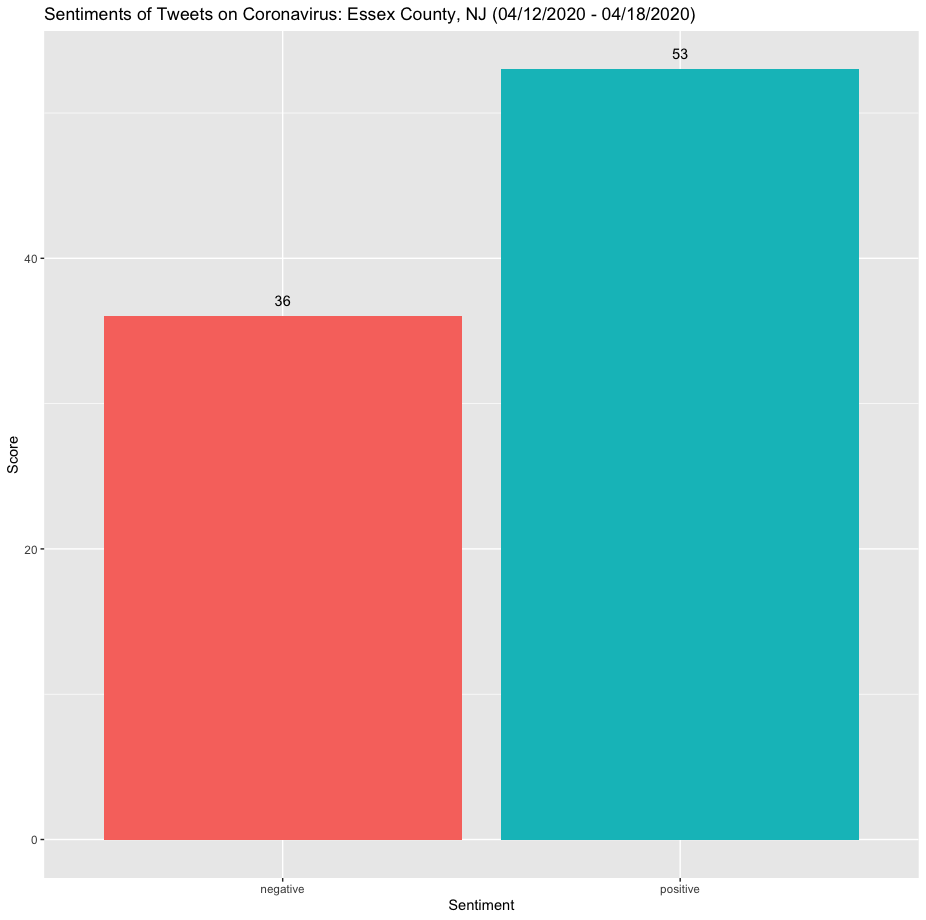
Negative Sentiment to Positive Sentiment Ratio: 36/53
Negative Sentiment to County Case Ratio: 36/9901
Positive Sentiment to County Case Ratio: 53/9901
Takeaways: Essex County, peculiarly, remains among New Jersey's most infected counties. Despite the greater count of positive tweet sentiments, this county ranks among the worst.
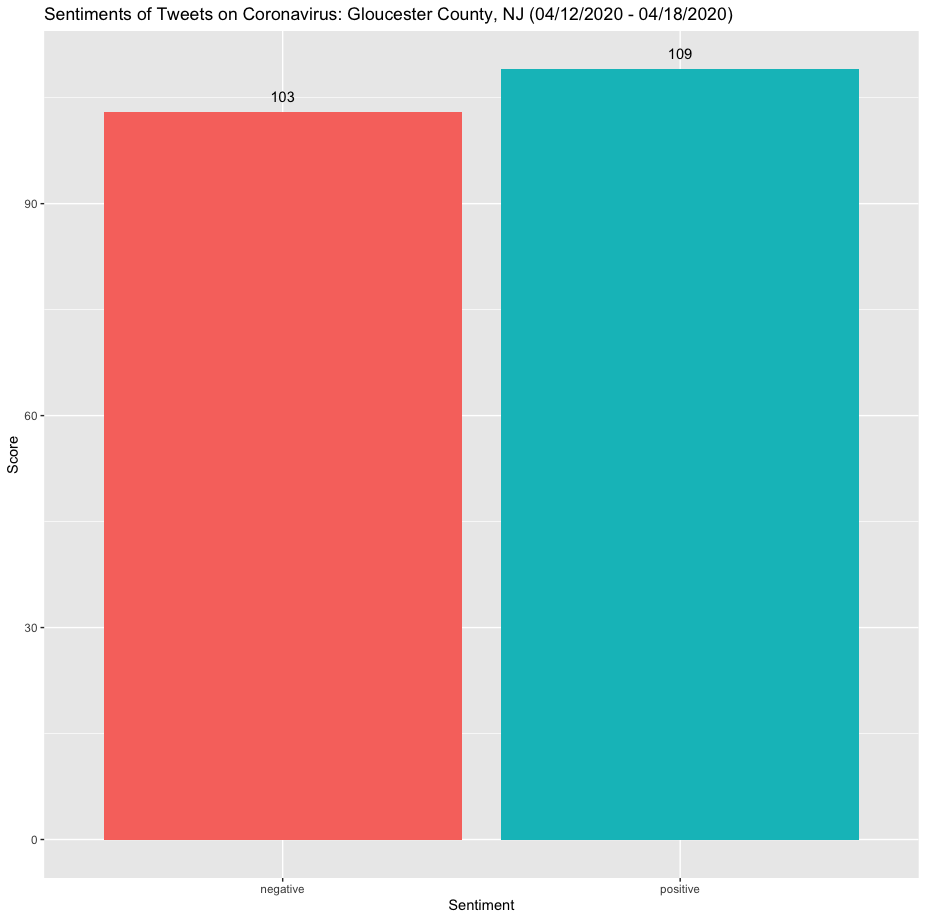
Negative Sentiment to Positive Sentiment Ratio: 103/109
Negative Sentiment to County Case Ratio: 103/683
Positive Sentiment to County Case Ratio: 109/683
Takeaways: Gloucester County's positive and negative tweet sentiments were very close, but exceeded the state county sentiment averages. At a near-equal ratio, the sentiments are clearly divided among the county.

Negative Sentiment to Positive Sentiment Ratio: 5/8
Negative Sentiment to County Case Ratio: 85/9956
Positive Sentiment to County Case Ratio: 34/2489
Takeaways: Hudson County, similar to other counties in the northern part of the state, exhibited a contradictory behavior. Despite the larger amount of positive tweet sentiments, the county is among the state's most infected.
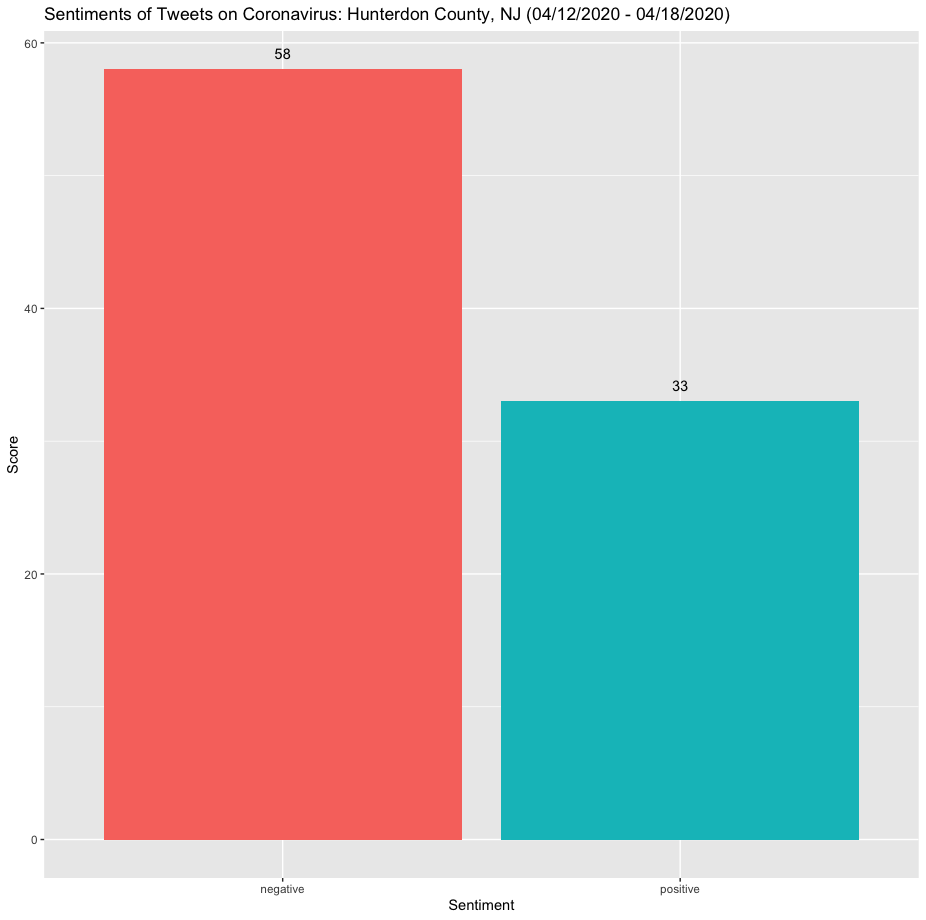
Negative Sentiment to Positive Sentiment Ratio: 58/33
Negative Sentiment to County Case Ratio: 58/391
Positive Sentiment to County Case Ratio: 33/391
Takeaways: Hunterdon County exhibits negative tweet sentiments at an almost 2:1 ratio. However, the county is also among the state’s least infected.
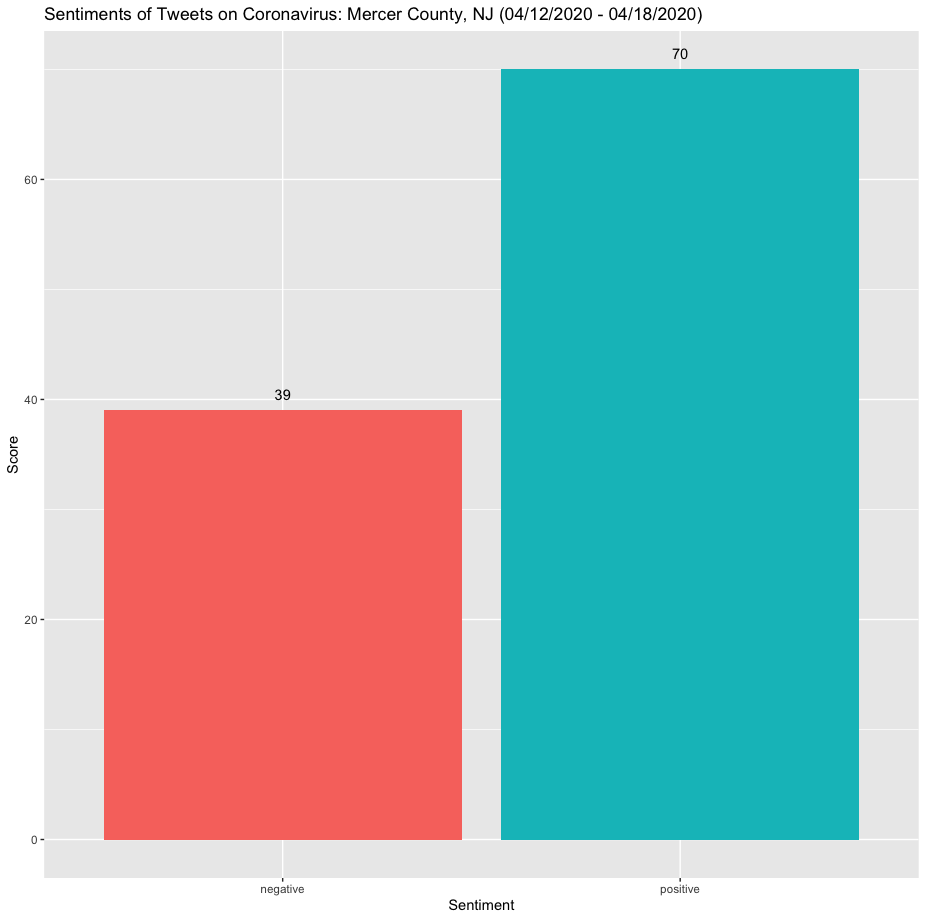
Negative Sentiment to Positive Sentiment Ratio: 39/70
Negative Sentiment to County Case Ratio: 39/2215
Positive Sentiment to County Case Ratio: 14/443
Takeaways: Mercer County, located in the central portion of New Jersey, coincidentally ranks in the middle with regard to case severity. Its positive tweet sentiments greatly outweigh its negative ones.
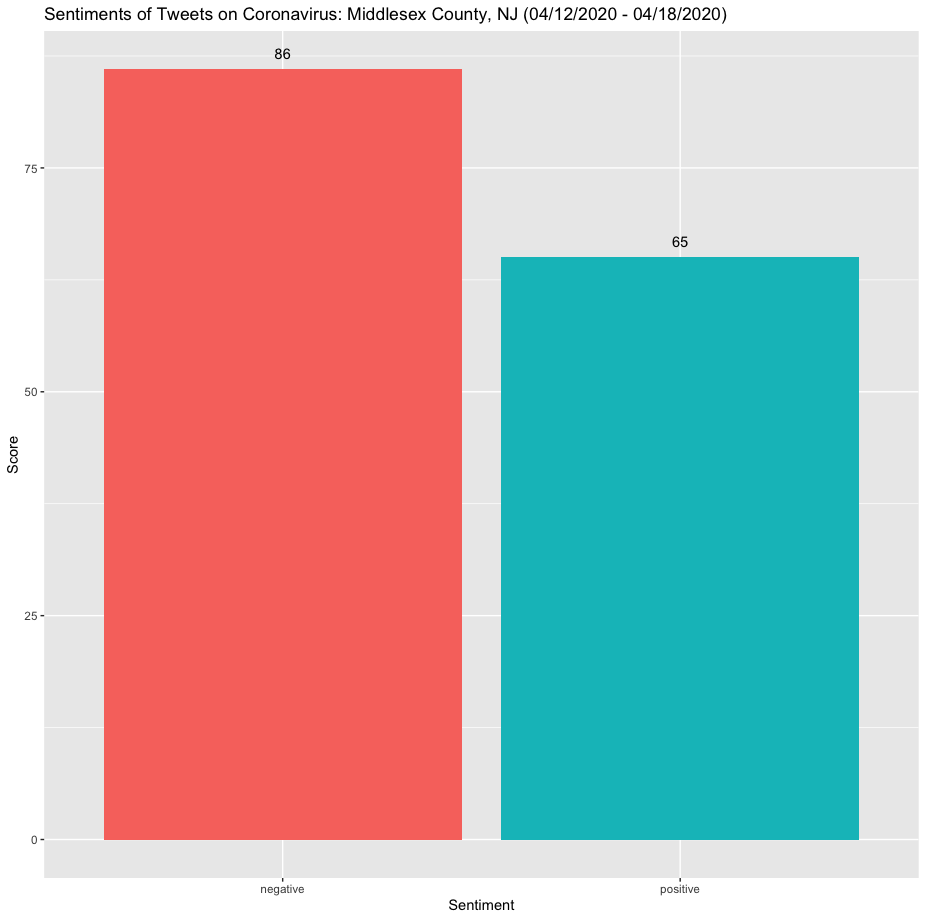
Negative Sentiment to Positive Sentiment Ratio: 86/65
Negative Sentiment to County Case Ratio: 43/3812
Positive Sentiment to County Case Ratio: 65/7624
Takeaways: Middlesex County, ranking among New jersey's most infected counties, adheres to the alternate hypothetical model, with negative tweet sentiment counts exceeding positive counts.
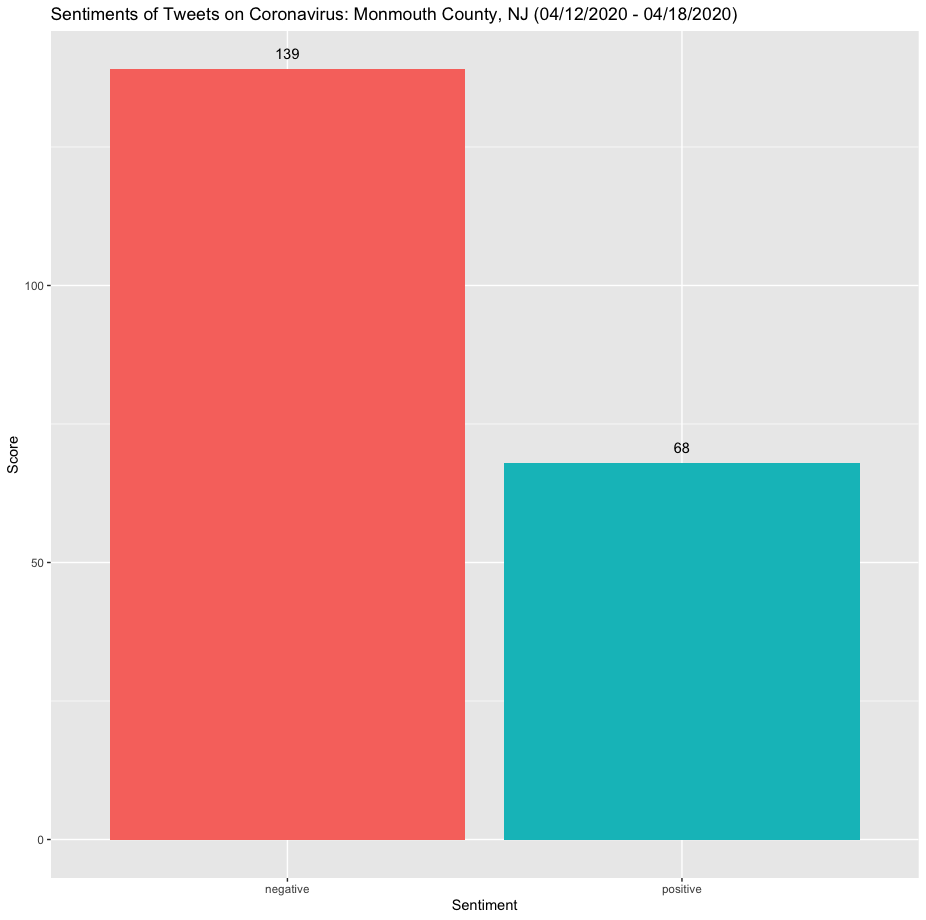
Negative Sentiment to Positive Sentiment Ratio: 139/68
Negative Sentiment to County Case Ratio: 139/4528
Positive Sentiment to County Case Ratio: 17/1132
Takeaways: Monmouth County possesses a large negative to positive tweet sentiment ratio. It has a case amount in the thousands and a ranking that nears the sates infection severity midpoint.
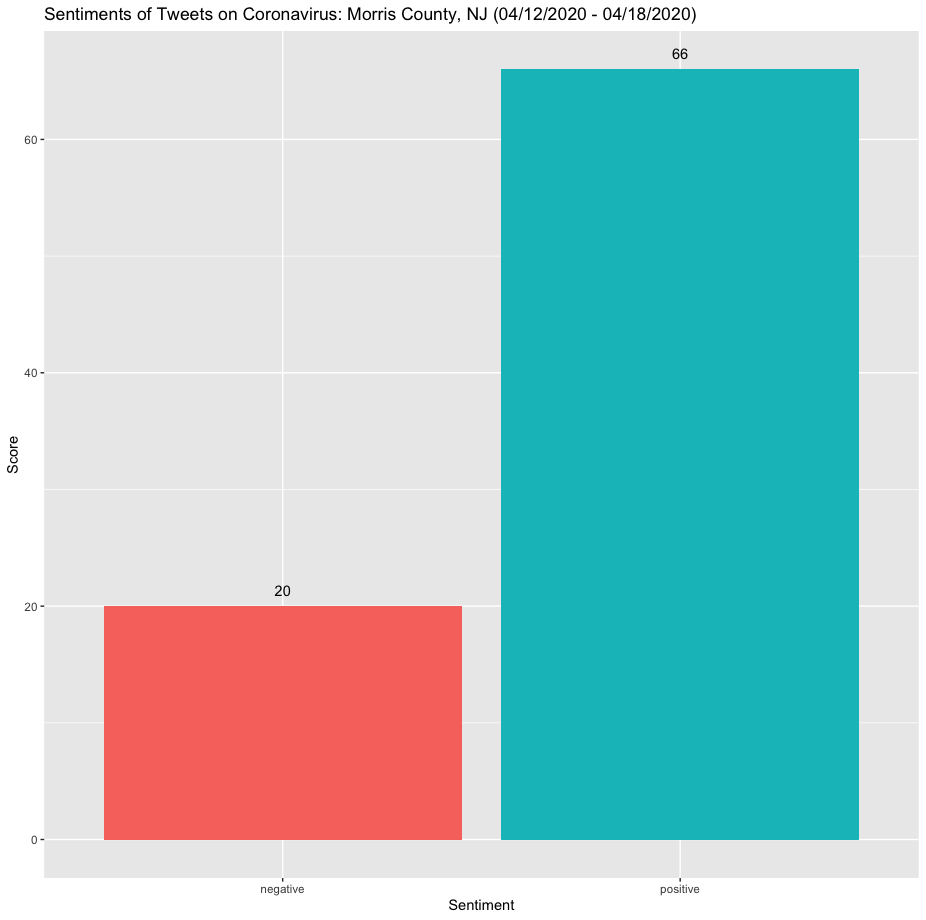
Negative Sentiment to Positive Sentiment Ratio: 10/33
Negative Sentiment to County Case Ratio: 5/996
Positive Sentiment to County Case Ratio: 11/664
Takeaways: Morris County, with around a 3:1 positive to negative tweet sentiment ratio, ranks near the state's midpoint in infection severity. Given the county's location in the COVID-19 hotspot region, the ratio indicates a likelihood of sentiment effects on case counts.
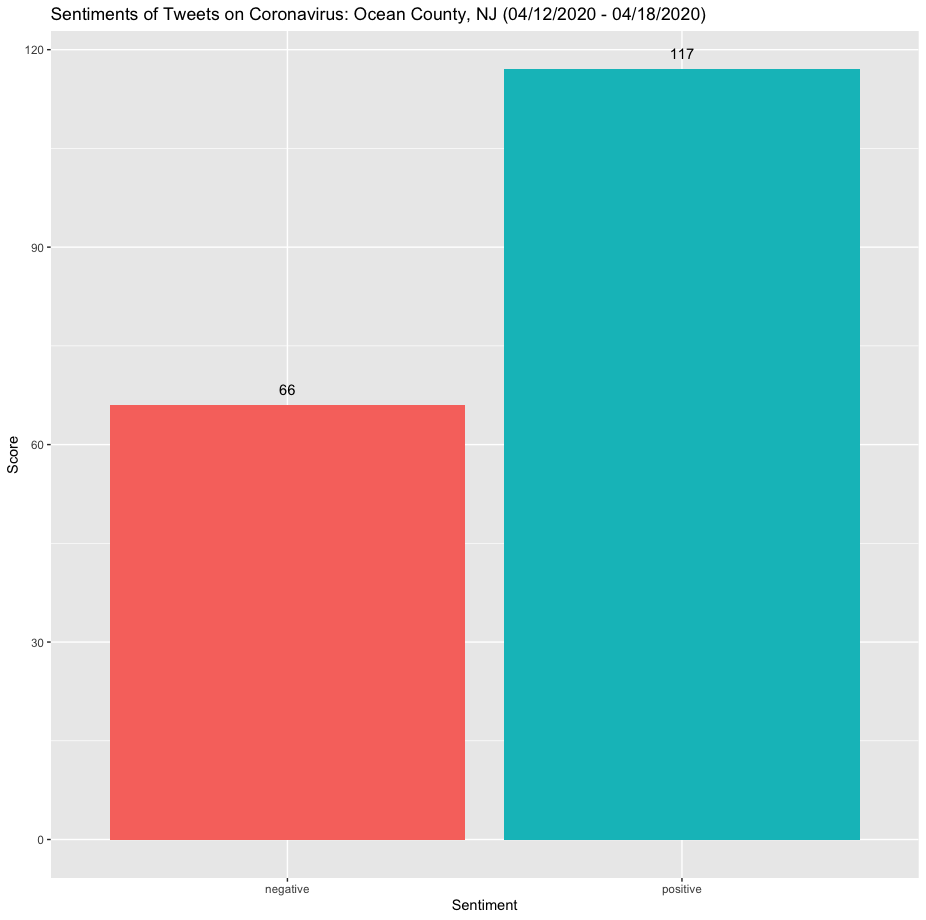
Negative Sentiment to Positive Sentiment Ratio: 22/39
Negative Sentiment to County Case Ratio: 11/758
Positive Sentiment to County Case Ratio: 39/1516
Takeaways: Ocean County, New Jersey's second largest county in area, exhibits a sentiment ratio moderately consistent with the alternative hypothetical model. Its positive tweet sentiments are noticeably larger in count than negative tweet sentiments.
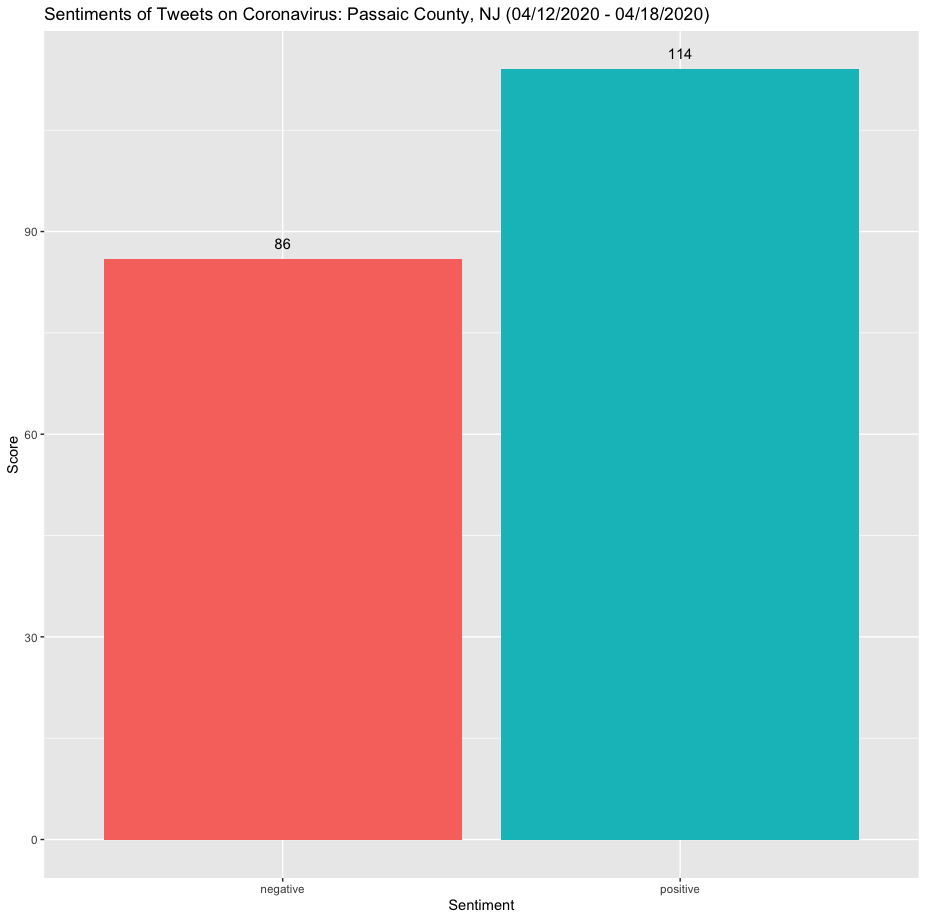
Negative Sentiment to Positive Sentiment Ratio: 43/57
Negative Sentiment to County Case Ratio: 43/3968
Positive Sentiment to County Case Ratio: 57/3968
Takeaways: Passaic County possesses a near 3:2 positive to negative tweet sentiment ratio. Despite this occurrence, the county is located in a COVID-19 hotspot cluster in the state's northern region. Even with economic disadvantages, it avoids the top rank in outbreak severity.
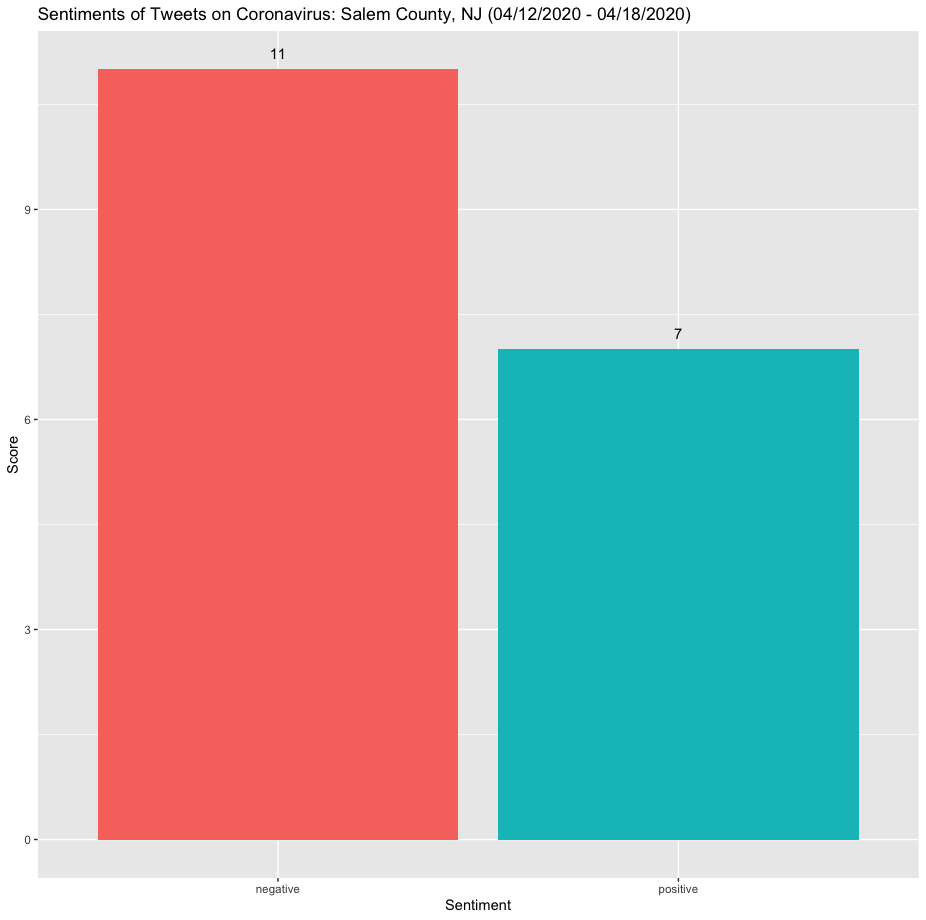
Negative Sentiment to Positive Sentiment Ratio: 11/7
Negative Sentiment to County Case Ratio: 11/105
Positive Sentiment to County Case Ratio: 1/15
Takeaways: Salem County is among the state's lowest in outbreak count, but possesses an 11:7 negative to positive tweet sentiment ratio. This may largely be due to the lack of COVID-19 related tweets in the area, given that it is the least populous county in the state.
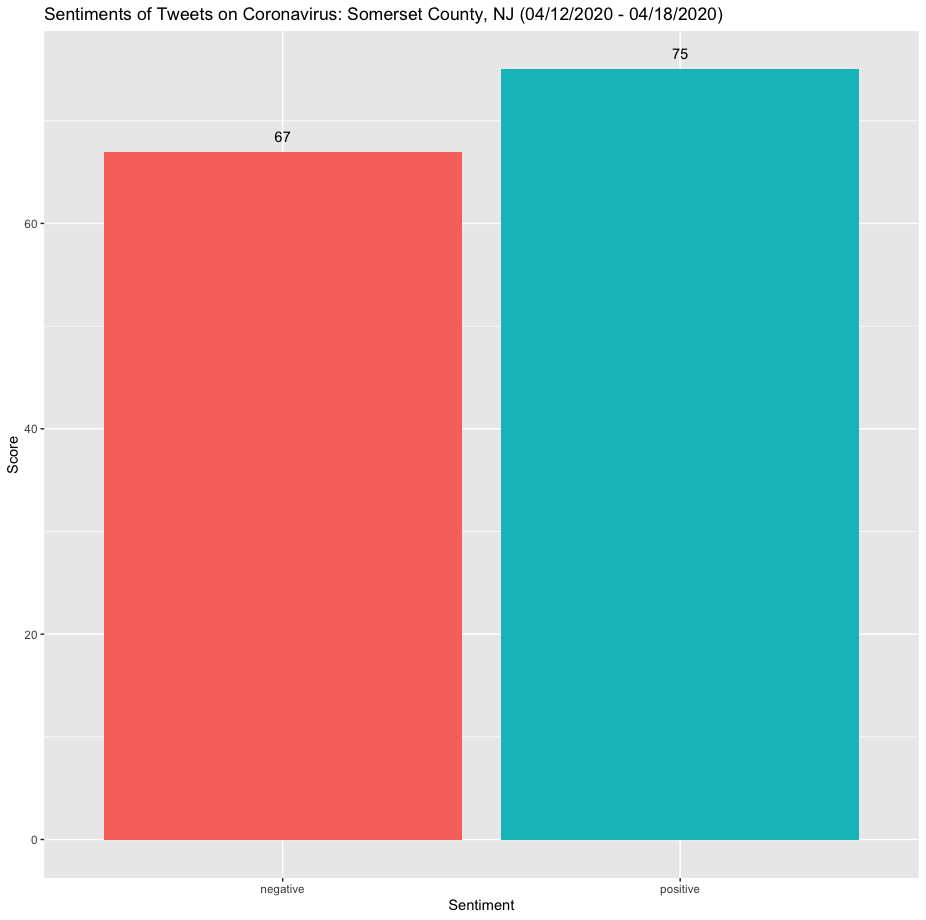
Negative Sentiment to Positive Sentiment Ratio: 67/75
Negative Sentiment to County Case Ratio: 67/2283
Positive Sentiment to County Case Ratio: 25/761
Takeaways: Somerset County, with a near 8:7 positive to negative tweet sentiment ratio, adheres to the alternative hypothetical model. Its case outbreak count ranks on the lower end of the state's outbreak severity midpoint.
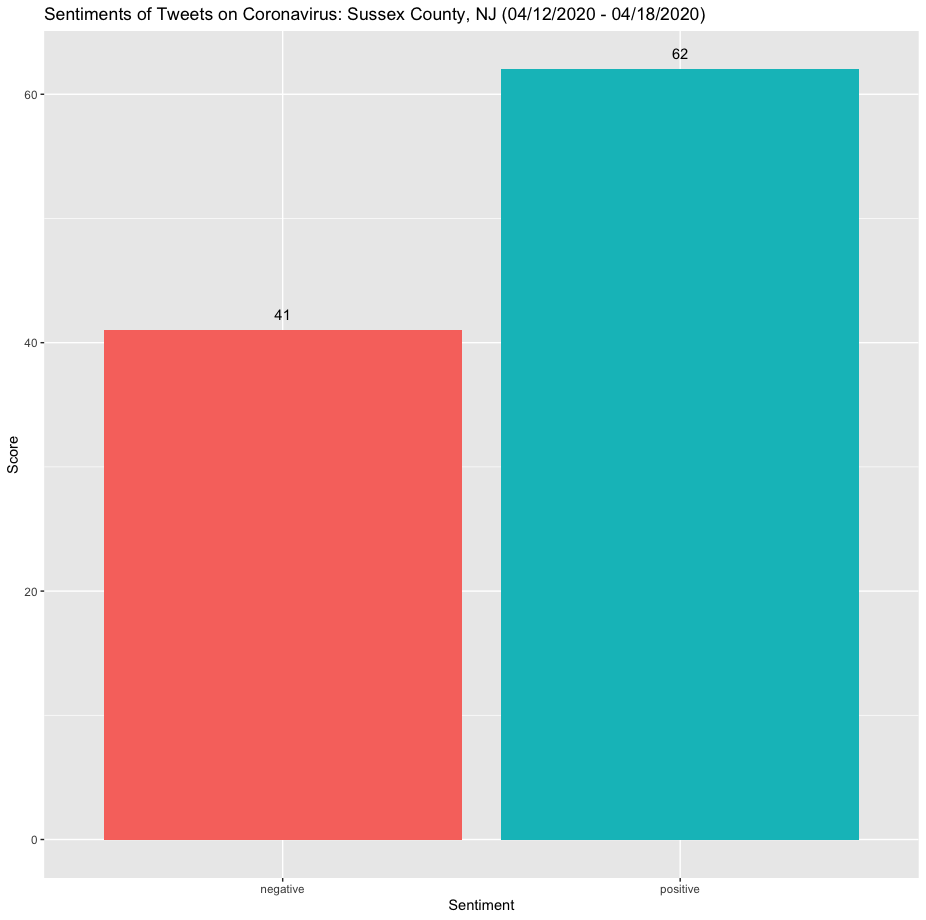
Negative Sentiment to Positive Sentiment Ratio: 41/62
Negative Sentiment to County Case Ratio: 41/626
Positive Sentiment to County Case Ratio: 31/313
Takeaways: Sussex County, with an approximate 3:2 positive to negative tweet sentiment ratio, adheres to the alternative hypothetical model. It ranks among the state's lowest in infection severity.
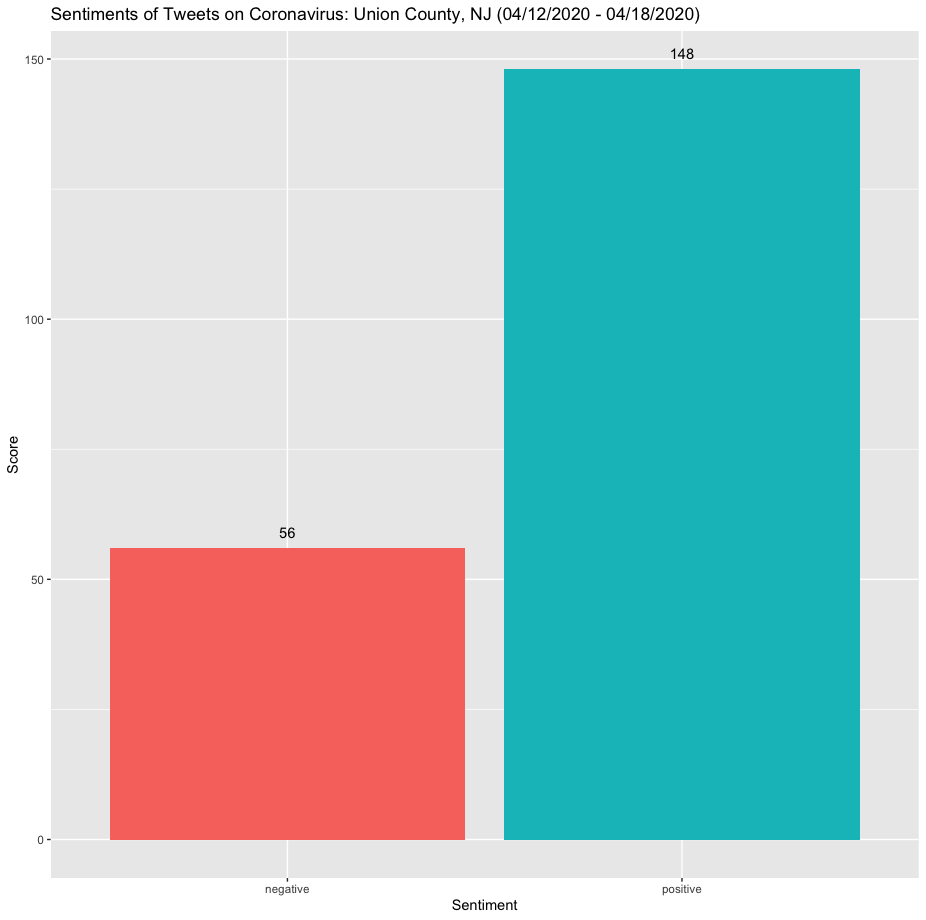
Negative Sentiment to Positive Sentiment Ratio: 14/37
Negative Sentiment to County Case Ratio: 56/8959
Positive Sentiment to County Case Ratio: 148/8959
Takeaways: Union County, despite its significant 37:14 positive to negative tweet sentiment ratio, does not remain consistent with the alternative hypothetical model. It ranks among the state's worst in county outbreak severity, despite its significant positive tweet sentiment count.

Negative Sentiment to Positive Sentiment Ratio: 37/41
Negative Sentiment to County Case Ratio: 37/543
Positive Sentiment to County Case Ratio: 41/543
Takeaways: Warren County, with a near 1:1 positive to negative tweet sentiment ratio, exhibits sentiment similarities similar to other large counties. Despite this, it ranks among the state's lowest in county outbreak severity.